Guide · Expedition weather
Expedition weather by month, from ten years of records
By AdventureLive · Updated
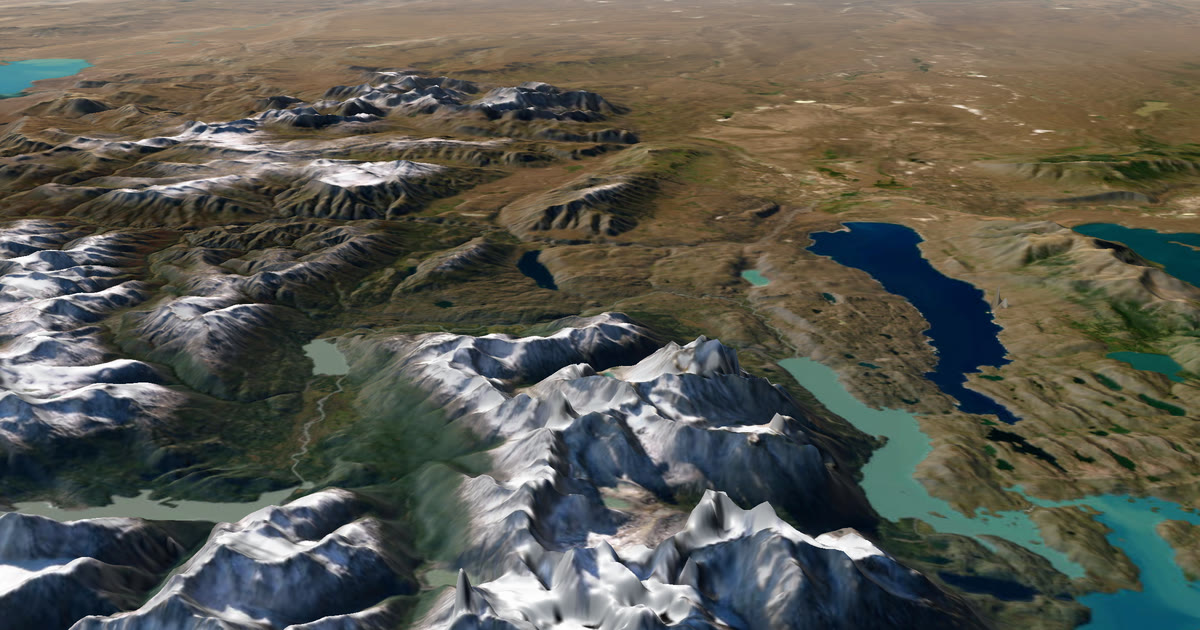
When should you go? The honest first answer is: look at what the weather has usually done in that month. This guide uses ten years of records (2015–2024) to show it for four of the world's best-known expeditions.
What does "typical weather for the month" tell you?
It tells you what to expect on average, and how far a month can swing either way. That is the right tool for choosing dates and for packing, months before any forecast exists.
It is not a promise. A month with a 14-knot average wind has calm days and gales. A month that averages 29.4 °C has afternoons well above that. Use typical weather to choose and prepare. Always check the forecast and local warnings before you go.
What is ERA5?
ERA5 is a reanalysis. A reanalysis takes decades of real observations (weather stations, balloons, ships, aircraft and satellites) and runs them through a fixed weather model. The result is a complete, consistent record of the atmosphere.
ERA5 comes from the Copernicus Climate Change Service (C3S), which is run by the EU and the European Centre for Medium-Range Weather Forecasts. It gives hourly weather for the whole globe since 1940. The grid is about 31 km wide (0.25 degrees).
Two things make it useful for expeditions:
- It covers places with no weather stations. The mid-Atlantic, the Sahara and the Namib have almost none. ERA5 fills the gap with the model, anchored by satellite and other data.
- It is consistent. Every place and every month is measured the same way, so you can compare the Atlantic with the Sahara fairly.
We took monthly averages for 2015–2024 from the Copernicus Climate Data Store. We also kept the highest and lowest of the ten yearly values, so each table can show the spread. The method for each number is stated on each page.
What are the limits?
There are three.
- A grid cell is not a summit rock. Every value is an average over about 31 km. On a mountain, in a canyon or on a dune crest, the real weather can differ. Desert sand in full sun is far hotter than the air temperature ERA5 gives.
- An average hides extremes. The monthly means hide calms, squalls, storms and the hottest afternoons.
- It is not a forecast. Beyond about 10 days, nobody can forecast a given day. Within about 10 days, the forecast is the better guide, and it takes over.
Rain is the least reliable figure. Totals are patchy and vary a lot from year to year. Where we show rain, we show the spread across the ten years as well.
How does AdventureLive use this?
When you plan a trip, each leg gets a weather panel. For dates more than about 10 days ahead, it shows the typical weather for the dates, from ten years of records. Closer in, it shows the forecast from Apple Weather.
Once a trip is live, followers see the weather where you are, now and for the next 48 hours, with alerts for strong wind, cold, heat, heavy rain and thunderstorms. Plan your trip to see it for your own dates. The help page on weather and flying the route explains each panel.
Why ten years, and why these four places?
One year can be strange. A very wet January or a heatwave April tells you little about the next one. Ten years (2015–2024) is long enough to give a sensible average, and it also gives a spread: the hottest, coolest, wettest and driest of the ten yearly values.
The spread often matters more than the average. In Windhoek, the average January is 127 mm of rain, but the ten Januaries ranged from 16 mm to 450 mm. A traveller who reads only the average is surprised by half the years.
We chose four places where the date decides the trip:
- The Atlantic, where the start window decides the wind behind you.
- The Sahara, where the month decides whether afternoons are 29.4 °C or 42.3 °C.
- Namibia, where the month decides whether the roads are dry or can flood.
- Kilimanjaro, where the season decides how dry the mountain is and how hard the wind bites.
Each page has the full table, the source, the method in one sentence and the caveats, so you can check our reading yourself.
How should I use typical weather to choose a date?
Use it in three steps.
- Find the window. Look at the whole year, not only your preferred month. The best month is often next to the one you had in mind.
- Look at the spread. Check the hottest, coolest, wettest and driest years. Plan for the hard end of the range, not the middle.
- Then watch the forecast. From about 10 days out, the forecast is the better guide. Typical weather tells you what to pack. The forecast tells you what to do this week.
None of this makes a trip safe. It helps you choose and prepare. Check the forecast and local warnings before you go, and again each day on the way.
What should I do with the numbers?
Turn each number into a decision.
- Wind. A tailwind of 14 knots on the Atlantic means a faster crossing, but a 14-knot average hides gales. Plan your gear and your rest for the rough days.
- Heat. An afternoon average of 29.4 °C in the Sahara means you will face hotter hours. Train and pack for the upper end of the range.
- Cold. A 6 °C dawn in Windhoek in winter means warm layers for camp, even when the afternoon is 21 °C.
- Rain. A wide ten-year spread means spare days and local advice on roads and rivers.
How do the four compare at a glance?
| Expedition | Best window in the data | Headline number | What to watch |
|---|---|---|---|
| Atlantic row | December to February | About 14 knots of trade wind at mid-ocean | A light, changeable start off La Gomera |
| Marathon des Sables | April is the race month | 29.4 °C afternoons, 17.7 °C pre-dawn | The hottest April averaged 31.6 °C |
| Namibia overlanding | May to September for the dry roads | 127 mm in a Windhoek January | A ten-year spread of 16 mm to 450 mm |
| Kilimanjaro | June to September for the driest air | About -5 to -6 °C at summit height, all year | Wind chill from October to March |
Each row is an average. The pages behind them show the months either side, and the spread.
What does the Atlantic row weather look like?
The trade wind is the headline. In the race season (December to February) it averages about 14 knots at mid-ocean, blowing from the east-north-east, behind a boat heading west. At 18.5°N 50°W, about 91% of January and February wind is a tailwind.
The start is lighter. Off La Gomera, January wind averages 10.2 knots and only 60% of it helps. See Atlantic rowing weather by month for the full table, sea temperature and rain. For the tracking side, see ocean rowing live tracking.
How hot is the Marathon des Sables?
In April, the race month, afternoons average 29.4 °C at Merzouga, and the hottest April of the ten averaged 31.6 °C. Pre-dawn is 17.7 °C. Afternoon humidity is about 13%.
July is the peak, at 42.3 °C in the afternoon. See Marathon des Sables weather for all twelve months. For the tracking side, see Marathon des Sables live tracking.
When is the rainy season in Namibia?
December to March in Windhoek and Etosha. Windhoek averages 127 mm in January, and individual Januaries ranged from 16 mm to 450 mm. May to September is almost completely dry.
Sossusvlei, in the desert, gets no more than about 6 mm in any month on average. See Namibia weather for overlanding for the three-region table and the best months. For the tracking side, see overlanding live tracking.
What is the weather like on Kilimanjaro?
At summit height, the free-air temperature at night is about -5 to -6 °C in every month, because the tropics barely change with the seasons. Wind chill is what changes: a typical summit night feels like -10 to -12 °C, and in October one night in four has wind of 30 km/h or more.
The driest window is June to September, and May and June are the least windy. See Kilimanjaro summit weather by month for the full picture. For the climb itself, see Kilimanjaro live tracking and the satellite messenger for Kilimanjaro.
How do I read these tables?
- Source. Every table is from ERA5 (Copernicus Climate Change Service), 2015–2024.
- Averages, not forecasts. Say "on average", and expect days either side.
- Spread. Where we give the hottest year or the wettest year, it is the highest of the ten yearly values, not a single-day record.
- Times. "Afternoon" and "pre-dawn" are fixed local hours, stated under each table.
Where next?
Pick the expedition above, choose your dates, and then plan the trip. Family and friends can follow it free, thanks to ProLend, on one link with no app. See how to let family track you live on an adventure.
Contains modified Copernicus Climate Change Service information (2026). Neither the European Commission nor ECMWF is responsible for any use of this information.
All guides in this topic
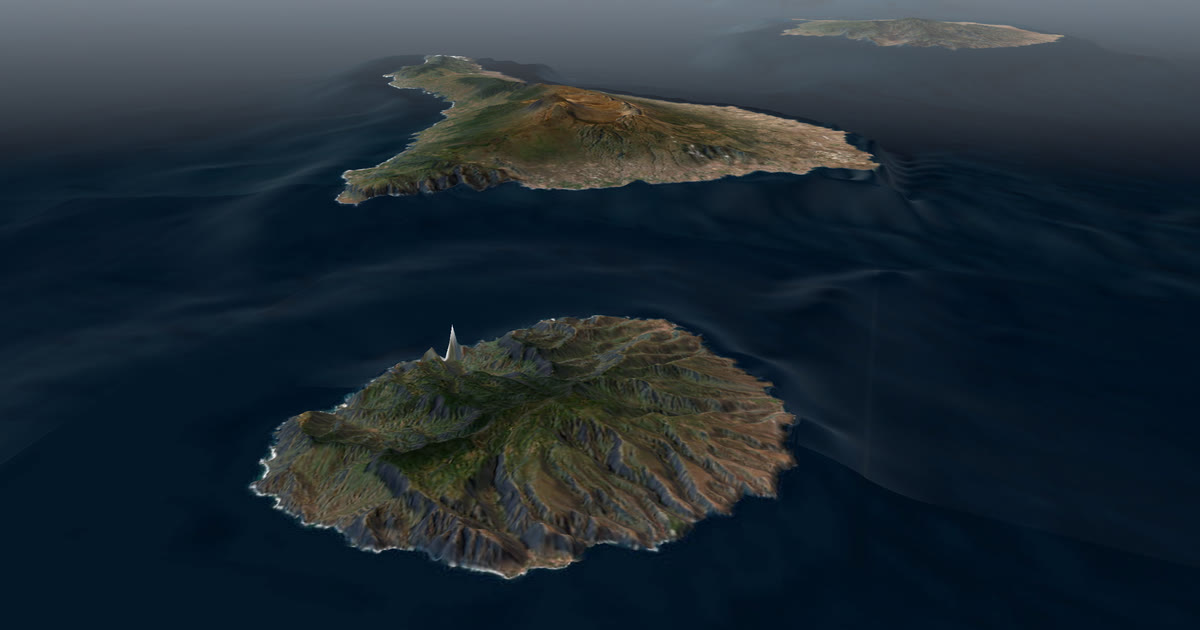 Weather data · Expedition weatherAtlantic rowing weather by month: the trade winds to AntiguaTen years of ERA5 records for the La Gomera to Antigua row: trade wind speed and direction, following-wind share, sea temperature and rain, month by month.
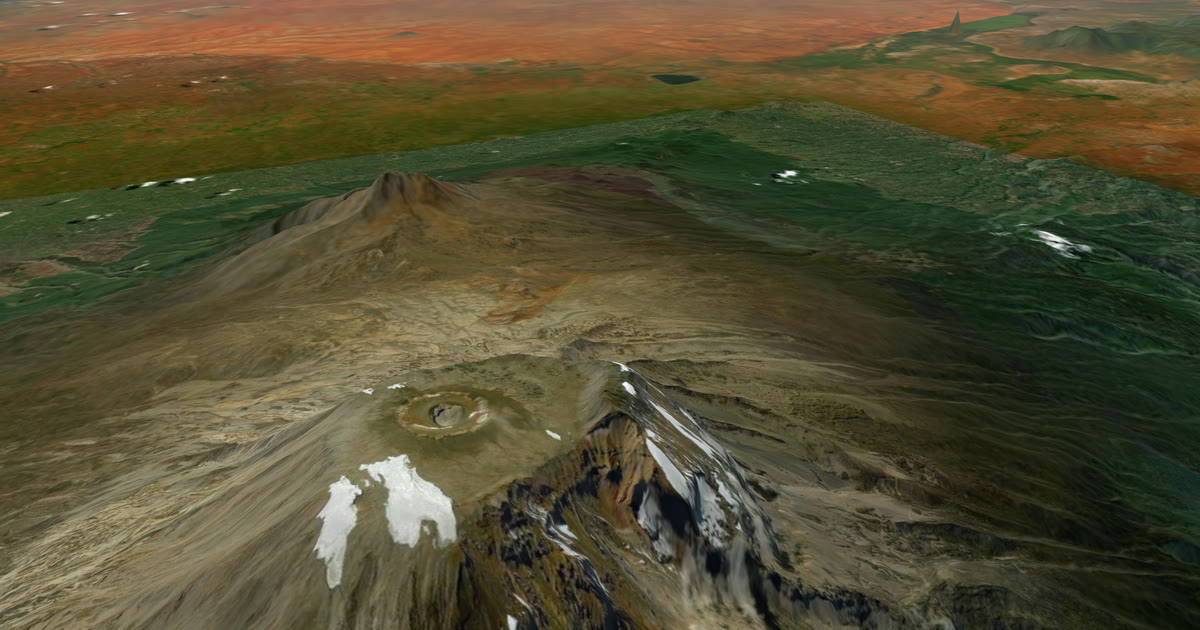 Weather data · Expedition weatherKilimanjaro summit weather by month: wind, cold and wind chillTen years of ERA5 records for Uhuru Peak: summit-night temperature, wind, wind chill and rain by month, and which months are driest and least windy.
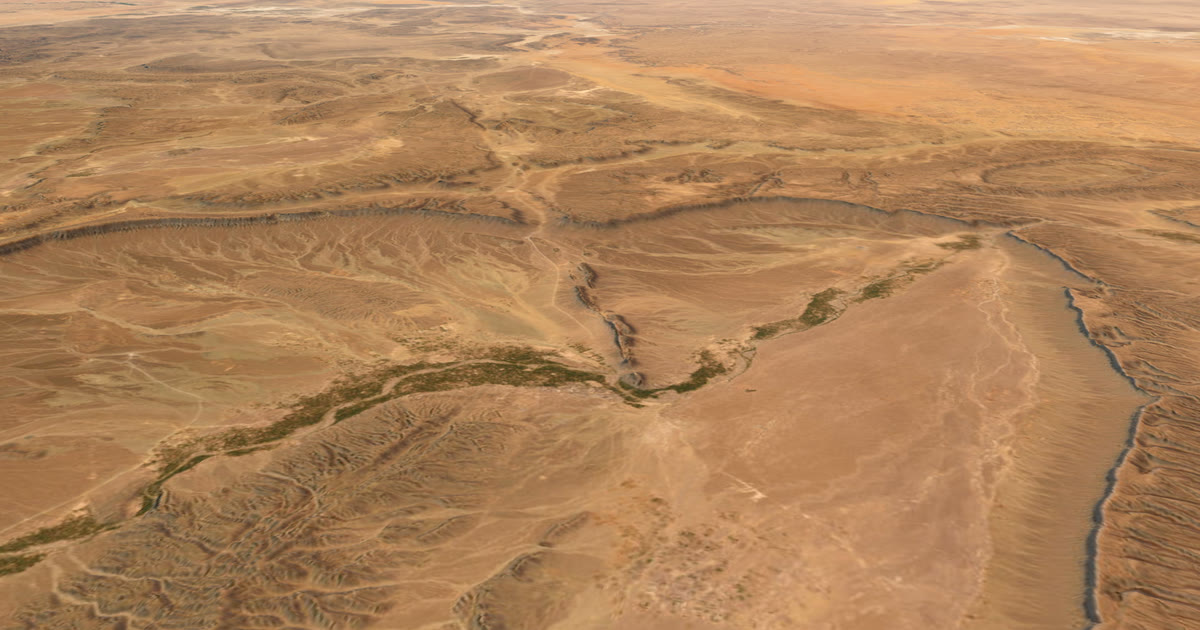 Weather data · Expedition weatherMarathon des Sables weather: how hot is April in the Sahara?Ten years of ERA5 records for Merzouga and Erg Chebbi: April afternoons average 29.4 °C, pre-dawn 17.7 °C, humidity 13%. All twelve months in a table.
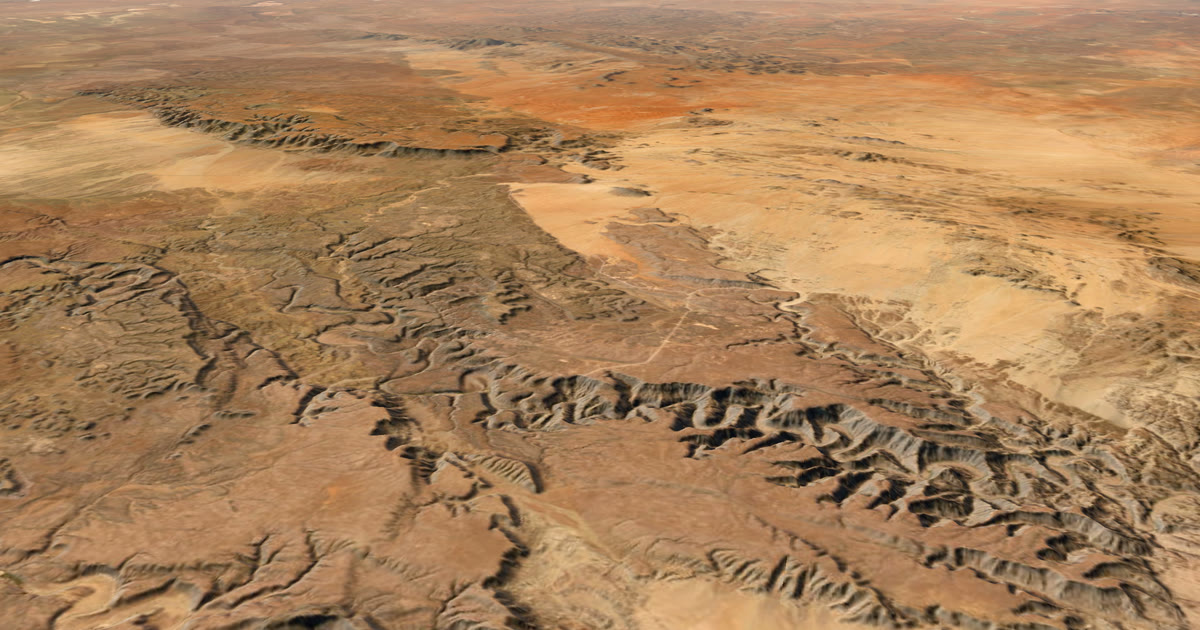 Weather data · Expedition weatherNamibia weather by month for overlandingTen years of ERA5 records for Windhoek, Sossusvlei and Etosha: rain, afternoon and pre-dawn temperatures by month, and the best months to go by region.
Questions people ask
- What is ERA5?
- ERA5 is a reanalysis from the Copernicus Climate Change Service, run by the EU. It combines past observations with a weather model to give hourly weather for the whole globe since 1940, on a grid of about 31 km.
- Is typical monthly weather a forecast?
- No. It is what the weather has been on average for that month over ten years. Individual days can be much hotter, colder, wetter or windier. Check the forecast and local warnings before you go.
- Why use ten years and not one?
- One year can be unusual. Ten years show the average and also the spread, such as the wettest and driest January in Windhoek, so you can see how much a month can vary.
- Can ERA5 tell me the weather on a summit or a dune?
- Not exactly. Each value is an average over a grid cell about 31 km wide. A summit rock, a dune crest or a canyon floor can differ from that average.
- Does AdventureLive show typical weather?
- Yes. When you plan a leg, AdventureLive shows the typical weather for the leg's dates, from ten years of records. Closer in, it shows the forecast for about the next 10 days.
Sources
- Copernicus Climate Data Store: ERA5 monthly averaged data on single levels
- Copernicus Climate Data Store: ERA5 hourly data on single levels
- Copernicus Climate Data Store: ERA5 monthly averaged data on pressure levels
- Copernicus Climate Change Service: ERA5 explained
- Contains modified Copernicus Climate Change Service information (2026)
Related guides
Weather data · Expedition weatherKilimanjaro summit weather by month: wind, cold and wind chillTen years of ERA5 records for Uhuru Peak: summit-night temperature, wind, wind chill and rain by month, and which months are driest and least windy.Weather data · Expedition weatherAtlantic rowing weather by month: the trade winds to AntiguaTen years of ERA5 records for the La Gomera to Antigua row: trade wind speed and direction, following-wind share, sea temperature and rain, month by month.Weather data · Expedition weatherMarathon des Sables weather: how hot is April in the Sahara?Ten years of ERA5 records for Merzouga and Erg Chebbi: April afternoons average 29.4 °C, pre-dawn 17.7 °C, humidity 13%. All twelve months in a table.Weather data · Expedition weatherNamibia weather by month for overlandingTen years of ERA5 records for Windhoek, Sossusvlei and Etosha: rain, afternoon and pre-dawn temperatures by month, and the best months to go by region. Guide · Live trackingHow to let family track you live on an adventureLet family follow you live when there is no phone signal: use a satellite tracker and one link with a map, the weather where you are, and home contacts.