Weather data · Expedition weather
Namibia weather by month for overlanding
By AdventureLive · Updated
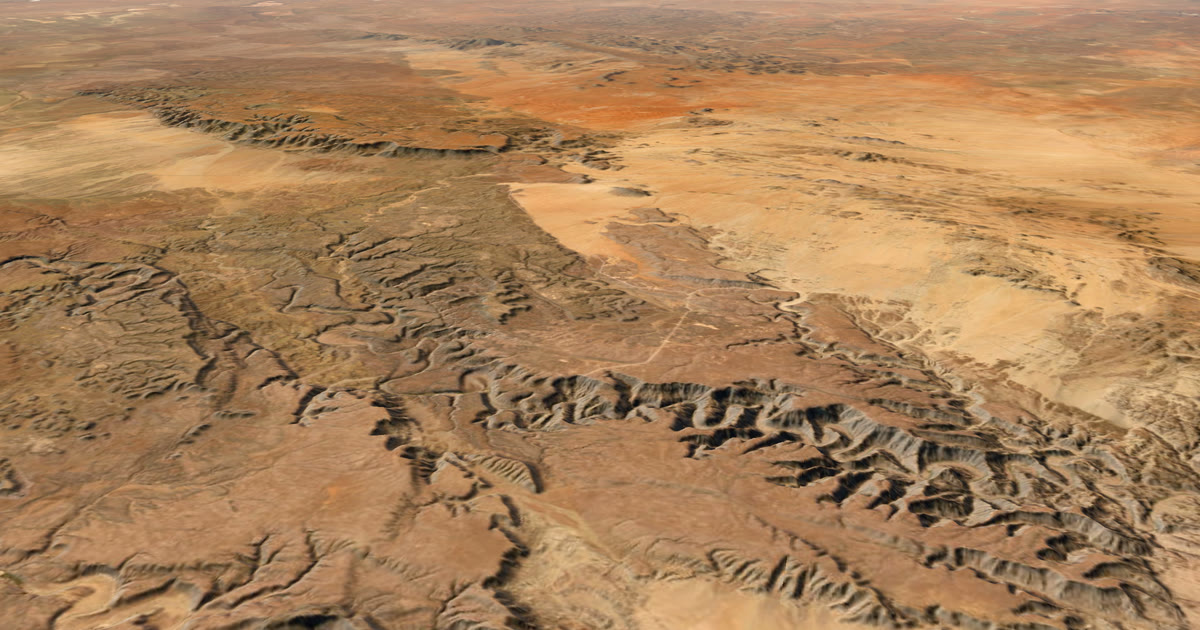
Namibia is two trips in one year. In the dry season the roads are firm and the mornings are cold. In the rainy season the north is hot and wet, and the gravel can flood. This guide shows both, for three places, from ten years of records.
When is the rainy season in Namibia?
December to March, in Windhoek and Etosha. Windhoek averages 127 mm in January and 107 mm in February. Etosha (Okaukuejo) averages about 96 mm in January, 86 mm in February and 82 mm in March.
May to September is almost completely dry, at 0–1 mm a month in Windhoek and Etosha.
Sossusvlei is a desert. It averages no more than about 6 mm in any month, and about 2 mm a month for most of the year.
What does each region look like by month?
Rain is the monthly total (mm). "Afternoon" is 14:00 local and "pre-dawn" is 05:00 local, in °C.
| Month | Windhoek rain | Windhoek afternoon / pre-dawn | Sossusvlei rain | Sossusvlei afternoon / pre-dawn | Etosha rain | Etosha afternoon / pre-dawn |
|---|---|---|---|---|---|---|
| Jan | 127 | 29.6 / 18.0 | 6 | 29.9 / 18.3 | 96 | 31.7 / 21.6 |
| Feb | 107 | 28.6 / 17.4 | 6 | 30.4 / 18.6 | 86 | 31.7 / 21.7 |
| Mar | 78 | 27.6 / 16.0 | 2 | 31.2 / 18.8 | 82 | 30.6 / 21.3 |
| Apr | 28 | 25.7 / 13.1 | 2 | 30.6 / 17.6 | 19 | 30.0 / 19.2 |
| May | 1 | 23.9 / 9.4 | 2 | 29.3 / 15.6 | 0 | 28.8 / 15.4 |
| Jun | 0 | 21.0 / 6.0 | 1 | 25.7 / 12.3 | 0 | 25.4 / 11.5 |
| Jul | 0 | 21.1 / 5.8 | 1 | 25.4 / 12.0 | 0 | 25.6 / 11.2 |
| Aug | 1 | 24.5 / 8.4 | 0 | 25.9 / 12.0 | 0 | 29.4 / 14.1 |
| Sep | 1 | 28.0 / 12.2 | 0 | 27.8 / 13.9 | 0 | 33.3 / 18.2 |
| Oct | 9 | 30.1 / 15.5 | 1 | 29.8 / 16.7 | 6 | 34.9 / 21.2 |
| Nov | 14 | 30.8 / 16.7 | 2 | 30.0 / 16.9 | 18 | 34.3 / 22.3 |
| Dec | 61 | 30.5 / 17.7 | 1 | 30.1 / 17.6 | 65 | 33.1 / 22.3 |
Source: ERA5 (Copernicus Climate Change Service), 2015–2024.
Method: bilinear-interpolated 0.25° ERA5 values at three points: total rain as a monthly total, and 2 m temperature at 14:00 and 05:00 local time (Namibia is UTC+2), from monthly means for each hour.
Caveats:
- ERA5 is a grid of about 31 km. Sossusvlei and Windhoek sit on steep terrain changes, so the smoothed cell can differ a few degrees from a town's weather station.
- The temperatures are monthly means of the 14:00 and 05:00 hours. The hottest afternoons and the coldest winter dawns are more extreme. Desert winter nights can touch freezing.
- Rain is a ten-year mean of monthly totals. It varies a lot from year to year.
- Rain-day counts are not available from monthly means.
How much does the rainy season vary?
A great deal. This is the key number for planning.
| Place and month | Ten-year average | Driest year | Wettest year |
|---|---|---|---|
| Windhoek, January | 127 mm | 16 mm | 450 mm |
| Windhoek, February | 107 mm | 8 mm | 281 mm |
| Windhoek, December | 61 mm | 26 mm | 152 mm |
| Etosha, January | 96 mm | 30 mm | 195 mm |
| Etosha, February | 86 mm | 6 mm | 236 mm |
| Etosha, March | 82 mm | 12 mm | 163 mm |
Windhoek's January ranged from 16 mm to 450 mm depending on the year. Two summers can feel like different countries.
So treat the average as the middle of a wide range. In a wet year, rivers rise and gravel roads can flood. In a dry year, the green season is quiet. Plan for the wet end if you travel from December to March.
Which months are best, by region?
It depends on what you want. These are readings of the numbers above, not rules.
- Windhoek and the central highlands: May to September. It is almost completely dry. Afternoons are 21–28 °C, but mornings are cold: about 6 °C at 05:00 in June and July.
- Sossusvlei and the Namib: almost any month is dry. The extremes are heat and cold. Afternoons are 30–31 °C from November through March, and about 25–26 °C in June to August, with pre-dawn near 12 °C.
- Etosha: May to September. It is dry, with clear skies and good game viewing around the waterholes. Heat peaks before the rains: October averages 34.9 °C at 14:00, and November 34.3 °C.
Etosha's summer nights stay warm, at about 21–22 °C at 05:00 from October to March. Its winter nights drop to about 11 °C.
What are the heat and cold like?
Heat peaks before the rains. Windhoek's afternoons are hottest in November, at about 30.8 °C. Sossusvlei is hot, 30–31 °C, from November through March.
Winter mornings inland are cold. In June and July, Windhoek averages about 6 °C at 05:00 and about 21 °C at 14:00. Etosha is 11 °C and 25 °C. Sossusvlei is about 12 °C. This is ERA5's smoothed cell, so real dawns in the dune field can be colder.
Pack for a daily swing of about 15 °C in winter: in Windhoek, 21 °C in the afternoon against 6 °C before dawn.
What does this mean for an overland trip?
Use typical weather to choose a month, then to pack and plan the route.
- Dry season (May to September): clear skies, cold mornings and good game viewing. Warm layers for dawn drives and camps.
- Green season (December to March): rain, heat and flooding risk on gravel roads. Build in spare days, and check the road and river state locally.
- Shoulder months (October, November, April): transitions. Etosha is at its hottest in October and November, and the rain starts to build.
- Sossusvlei: pick the month by temperature, not rain.
Typical weather helps you choose and prepare. Always check the forecast and local warnings before you go.
How can family follow an overland trip?
Namibia has long stretches with no phone signal. A Garmin inReach or SPOT sends positions by satellite. Link it to AdventureLive, plan the drive as legs, with a GPX or with no route, and share the trip link.
Followers open it in any browser, with no app or account. They see the dot on a 3D satellite map, when you were last seen, and the weather where you are, with alerts for heavy rain, heat and thunderstorms.
When you plan each leg, AdventureLive shows the typical weather for its dates, from these ten years of records, and the forecast closer in. It is free, thanks to ProLend.
See the set-up in overlanding live tracking. For another desert, see Marathon des Sables weather. The expedition weather hub has the rest.
Contains modified Copernicus Climate Change Service information (2026). Neither the European Commission nor ECMWF is responsible for any use of this information.
Questions people ask
- When is the rainy season in Namibia?
- December to March in Windhoek and Etosha. Windhoek averages 127 mm in January and 107 mm in February. Etosha averages about 96 mm in January, 86 mm in February and 82 mm in March. May to September is almost completely dry.
- What is the best month to visit Namibia?
- For dry roads, clear skies and game viewing around waterholes, May to September. The cost is cold mornings inland. For Sossusvlei alone, almost any month is dry.
- How cold is Namibia in winter?
- In June and July, Windhoek averages about 6 °C at 05:00 and 21 °C at 14:00. Etosha is 11 °C and 25 °C. Sossusvlei is about 12 °C before dawn, and real dune-field dawns can be colder.
- How variable is Namibia's rain?
- Very. Windhoek's January ranged from 16 mm to 450 mm across the ten years. Rain is the unpredictable part of the trip.
- How hot does Etosha get?
- Etosha is hottest in October, at about 34.9 °C at 14:00 (34.3 °C in November). Its summer nights stay warm, about 21–22 °C at 05:00 from October to March.
- Can my family follow my overland trip?
- Yes. Link a Garmin inReach or SPOT to AdventureLive, plan the drive as one or more legs, and share the trip link. Followers see your dot and the weather where you are, with alerts for heavy rain and heat.
Sources
Related guides
 Guide · Expedition weatherExpedition weather by month, from ten years of recordsTypical weather by month for Kilimanjaro, the Atlantic row, the Marathon des Sables and Namibia, from ten years (2015–2024) of ERA5 records.
 Guide · Live trackingOverlanding live tracking: let family follow every legLet family follow a Namibia or Outback overland trip live: a satellite tracker on the vehicle, one leg per stretch, and the weather where you are.
 Weather data · Expedition weatherMarathon des Sables weather: how hot is April in the Sahara?Ten years of ERA5 records for Merzouga and Erg Chebbi: April afternoons average 29.4 °C, pre-dawn 17.7 °C, humidity 13%. All twelve months in a table.
 Guide · Satellite trackersinReach vs SPOT vs ZOLEO for expeditionsinReach, SPOT and ZOLEO compared for expeditions: networks, coverage, tracking intervals, SOS, plan prices and weights, and which work with AdventureLive.